Solar Photovoltaic & Concentrated Solar Thermal

India has immense potential to develop its solar energy capacity. About 5,000 trillion kWh per year energy is incident over India’s land area with most parts receiving 4-7 kWh per sqm per day.
Government of India launched the JawaharLal Nehru National Solar Mission (JLNNSM) in 2010 under which it set a target to develop 20,000 MW of solar capacity by the year 2022. The desire was to not only move the economy towards more energy independence, but also create a self-sufficient industry supported by domestic production of critical raw materials, components and products.
In a bold move, in July 2015, the government decided to scale-up the National Solar Mission target from 20,000 MW to 1,00,000 MW by the year 2022. This capacity is proposed to be achieved through deployment of 40,000 MW of rooftop solar projects and 60,000 MW large and medium-scale solar projects. Accordingly, the Ministry of New & Renewable Energy (MNRE) chalked out year-wise cumulative target to achieve this 1,00,000 MW capacity.
Year-wise cumulative target up to 2022 (in MW)
| Year | Yearly Target (in MW) | Cumulative Target(in MW) |
|---|---|---|
| 2015-16 | 2,000 | 5,000 |
| 2016-17 | 12,000 | 17,000 |
| 2017-18 | 15,000 | 32,000 |
| 2018-19 | 16,000 | 48,000 |
| 2019-20 | 17,000 | 65,000 |
| 2020-2021 | 17,500 | 82,000 |
| 2021-22 | 17,500 | 1,00,000 |
(Source: MNRE)
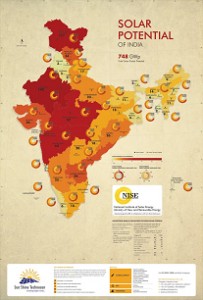
Meantime, an exercise to calculate the State-wise solar potential in the country was carried out by the National Institute of Solar Energy (NISE) The calculation has been made taking data from Census 2011 and the India Waste Land Atlas 2010, Ministry of Rural Development.
Estimated State-wise solar potential and cumulative installed capacity
| State | Solar Potential (GWp) | Cumulative Installed Capacity (MW) (as on 31.10.2016) |
|---|---|---|
| Andhra Pradesh | 38.44 | 968.05 |
| Arunachal Pradesh | 8.65 | 0.27 |
| Assam | 13.76 | 10 |
| Bihar | 11.2 | 95.10 |
| Chhattisgarh | 18.27 | 128.56 |
| Delhi | 2.05 | 23.87 |
| Goa | 0.88 | |
| Gujarat | 35.77 | 1,138.19 |
| Haryana | 4.56 | 17.39 |
| Himachal Pradesh | 33.84 | 0.20 |
| Jammu & Kashmir | 111.05 | 1 |
| Jharkhand | 18.18 | 16.84 |
| Karnataka | 24.7 | 340.08 |
| Kerala | 6.11 | 13.05 |
| Madhya Pradesh | 61.66 | 811.38 |
| Maharashtra | 64.32 | 386.06 |
| Manipur | 10.63 | |
| Meghalaya | 5.86 | |
| Mizoram | 9.09 | 0.1 |
| Nagaland | 7.29 | |
| Odisha | 25.78 | 66.92 |
| Punjab | 2.81 | 571.20 |
| Rajasthan | 142.31 | 1,301.16 |
| Sikkim | 4.94 | |
| Tamil Nadu | 17.67 | 1,555.41 |
| Telangana | 20.41 | 963.79 |
| Tripura | 2.08 | 5 |
| Uttar Pradesh | 22.83 | 143.5 |
| Uttarakhand | 16.8 | 41.15 |
| West Bengal | 6.26 | 11.77 |
| Union Territories | 0.79 | 16.69 |
The realisable solar potential in India is placed between 110 GW to 144 GW by the year 2024. Of this, 26-35 GW is the potential for small rooftops, 31-41 GW for commercial rooftops, 32-42 GW for utility-scale plants and 21-27 GW for GW-scale plants. Overall, solar could contribute 10-13 per cent to India’s grid power supply by 2024.
Status of Solar Capacity as on 31.10.2016
| Technology | Target for FY 2016-17 | Total capacity |
|---|---|---|
| Grid-interactive Solar Power | 12,000 MW | 8,727.64 MW |
| Off-grid/captive power SPV Systems | 100 MWe | 373.99 MWe |
(Source: MNRE)